How can we help?
-
Getting Started
-
documentation
-
releases
- Diese Artikel erscheinen demnächst
The Insights user interface looks like this:
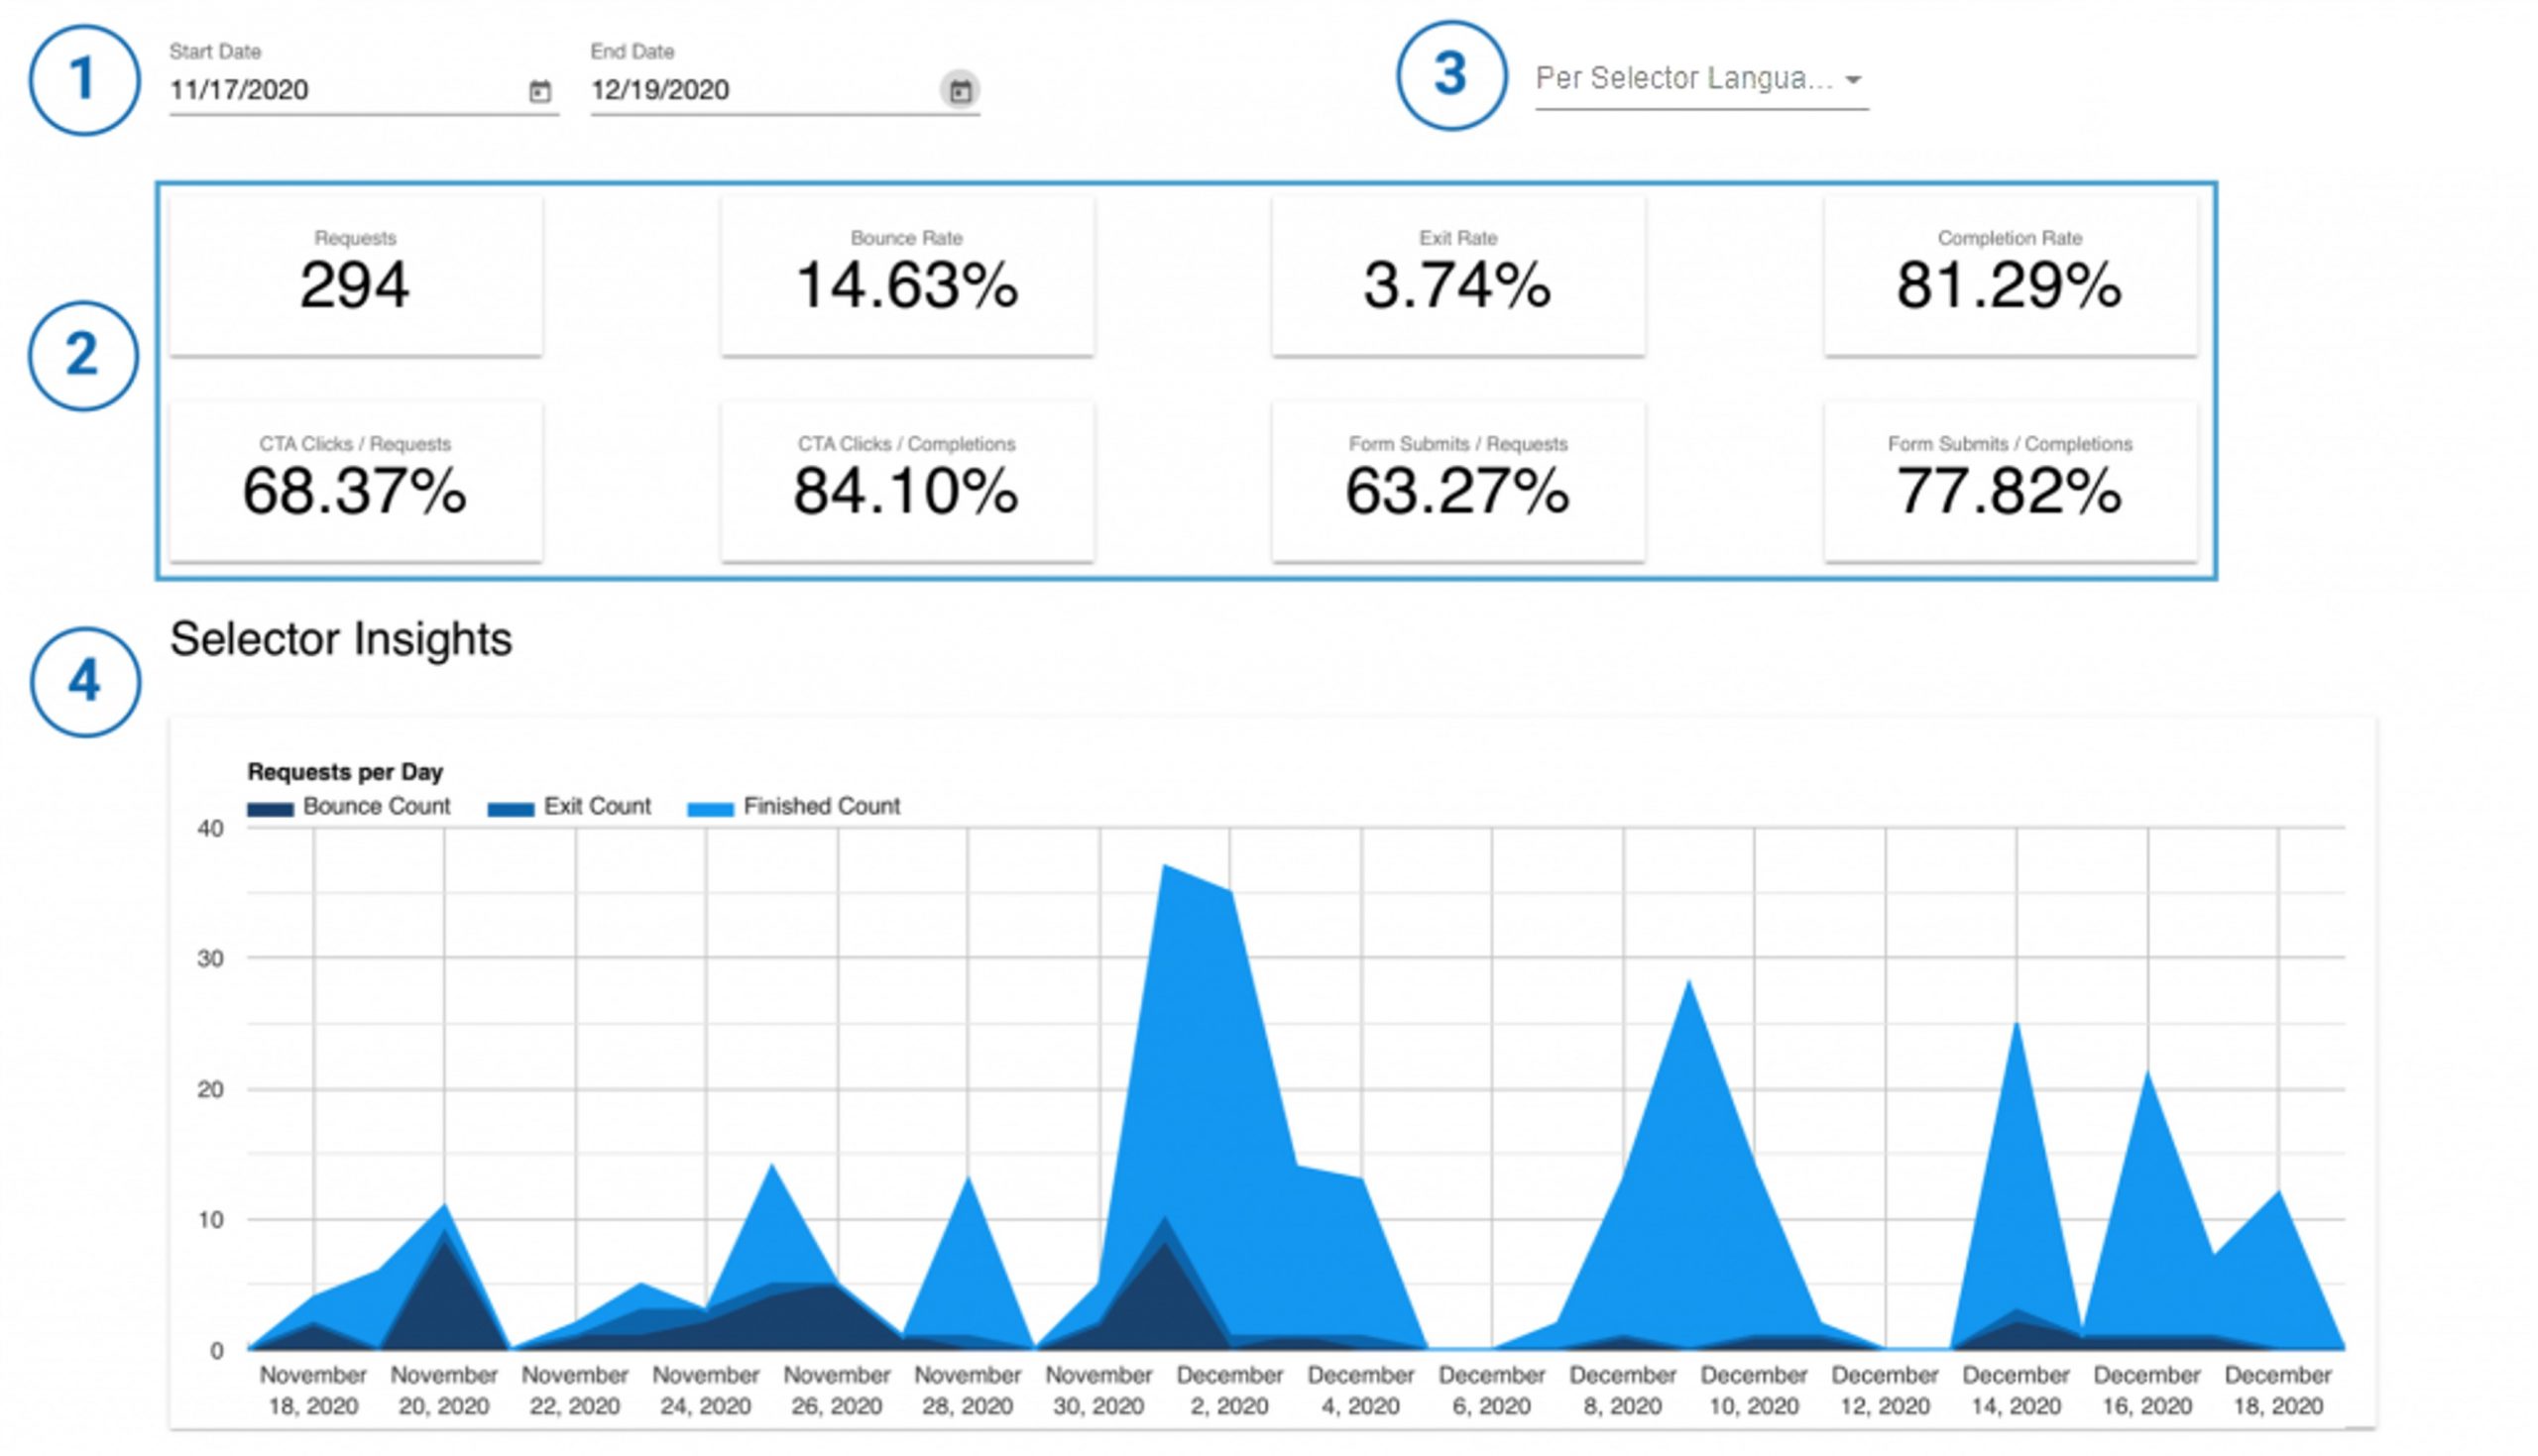
- Start Date - End Date: Select the analysis period you want to look at.
- metrics: You see an overview of the most important key figures.
- Language setting: If you use your selector in several languages, you can also analyze the key figures depending on the language.
- Graphic: View relevant parameters such as completion, bounce and exit rates in the graphical overview. You can read more about the key figures and benchmarks in this article.
Table of contents


